The Blob: the marine heatwave that changed Baja California's Pacific
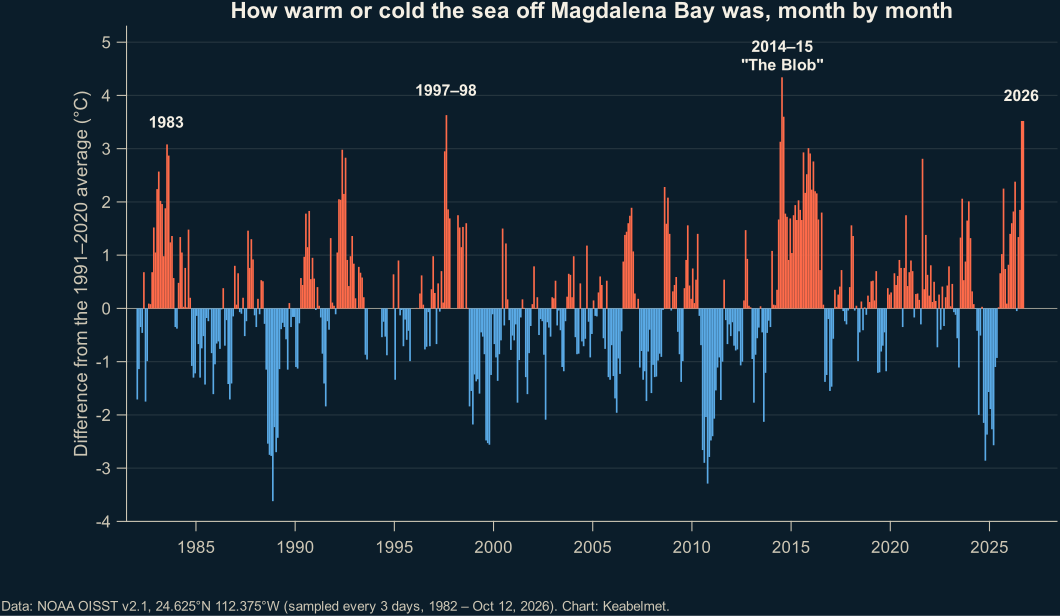
The Blob was a marine heatwave that between 2013 and 2015 covered much of the northeast Pacific and pushed tropical species farther north than ever [1]. In Magdalena Bay in 2015, upwelling weakened and nutrients and zooplankton dropped [2]; according to our analysis of NOAA data, the sea was 4.3 °C warmer than normal in July 2014 [5], and in July 2015 phytoplankton fell to a fifth of its usual level [4].
Before anyone talked about the 2026 super El Niño, the Pacific had already had a scare. Starting in 2013 a gigantic patch of abnormally warm water appeared, and scientists nicknamed it "The Blob". Its effects reached Baja California Sur.
Winners and losers
A review from the Scripps Institution of Oceanography documented the biological effects of this 2013–2015 warm anomaly [1]:
- A harmful algal bloom stretched from the Aleutian Islands to southern California [1].
- Mass strandings of marine mammals and seabirds occurred along the west coast of the US and Canada [1].
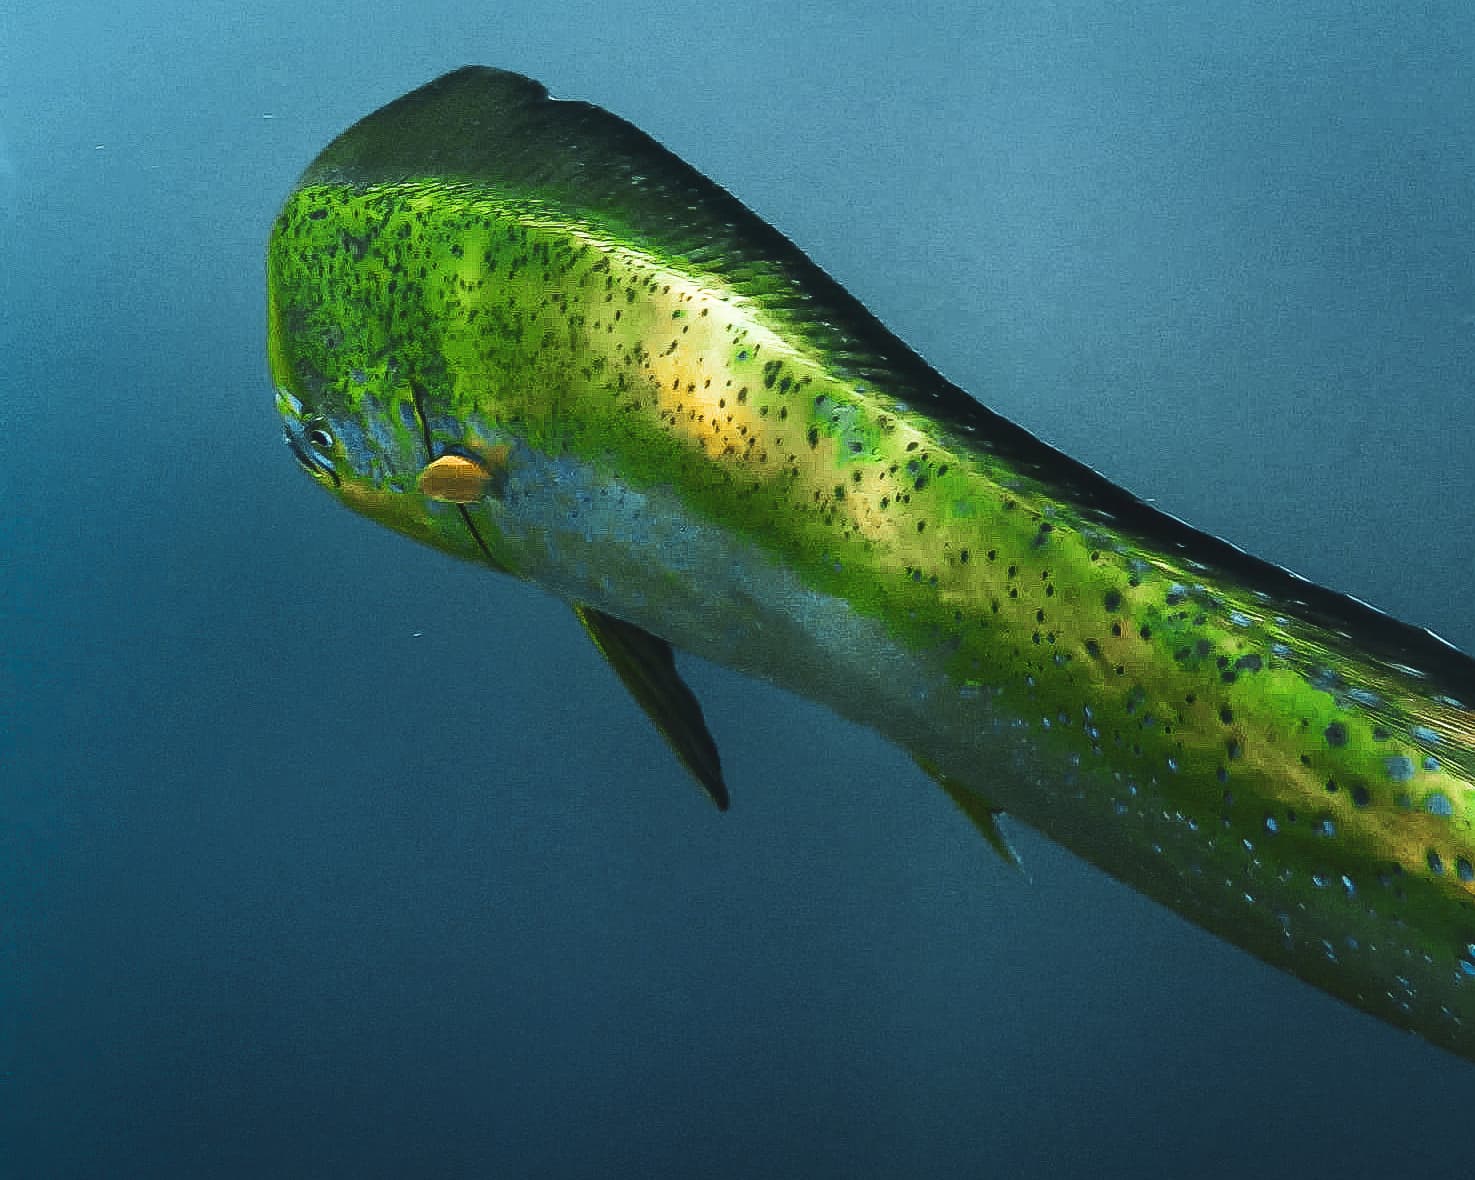
- Warm-water species like thresher sharks, hammerheads and mahi-mahi were seen farther north than ever before [1].
- Bluefin tuna showed up in record numbers in California waters, and beaches were covered in tuna crabs [1].
How it felt in Magdalena Bay
A study using field and satellite data from 2015 to 2017 showed that in Magdalena Bay in 2015 air temperature was very high, upwelling weakened, the water had tropical characteristics and oxygen, nutrients and chlorophyll fell. The autumn phytoplankton bloom didn't happen, and zooplankton was scarcer from the second half of 2015 through 2017 [2].
Using satellite chlorophyll data, we compared 2015 to normal. The result is striking: in April and May there was more phytoplankton than usual (the diatom Eucampia zodiacus bloomed in April [2]), but from June to August it crashed: in July it was 0.31 mg/m³, versus a median of 1.50 [4].
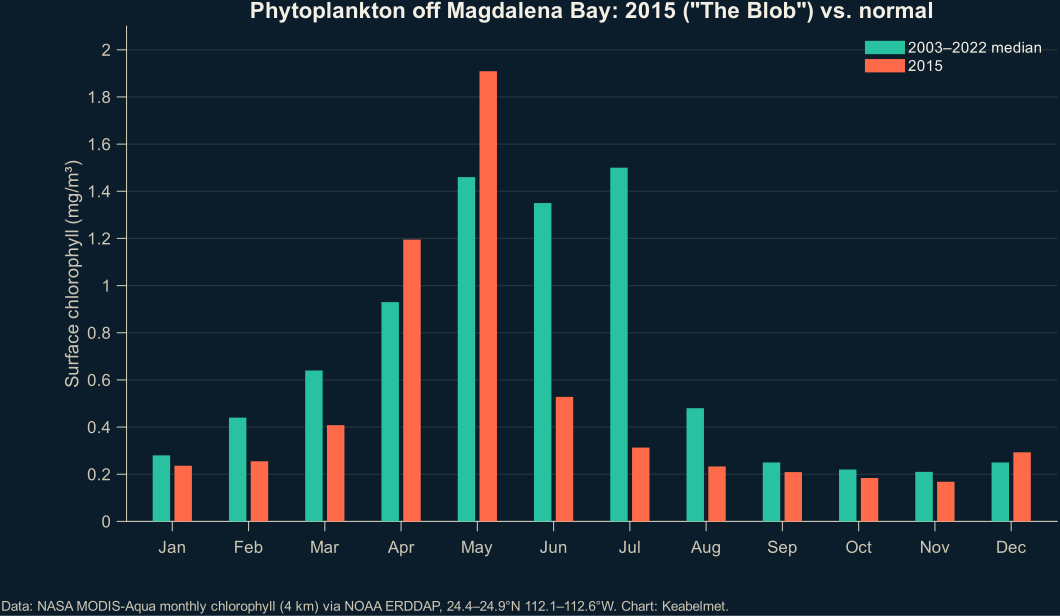
See the chart data
| Month | 2003–2022 median (mg/m³) | 2015 (mg/m³) |
|---|---|---|
| Jan | 0.28 | 0.24 |
| Feb | 0.44 | 0.25 |
| Mar | 0.64 | 0.41 |
| Apr | 0.93 | 1.19 |
| May | 1.46 | 1.91 |
| Jun | 1.35 | 0.53 |
| Jul | 1.50 | 0.31 |
| Aug | 0.48 | 0.23 |
| Sep | 0.25 | 0.21 |
| Oct | 0.22 | 0.18 |
| Nov | 0.21 | 0.17 |
| Dec | 0.25 | 0.29 |
A domino effect on wildlife
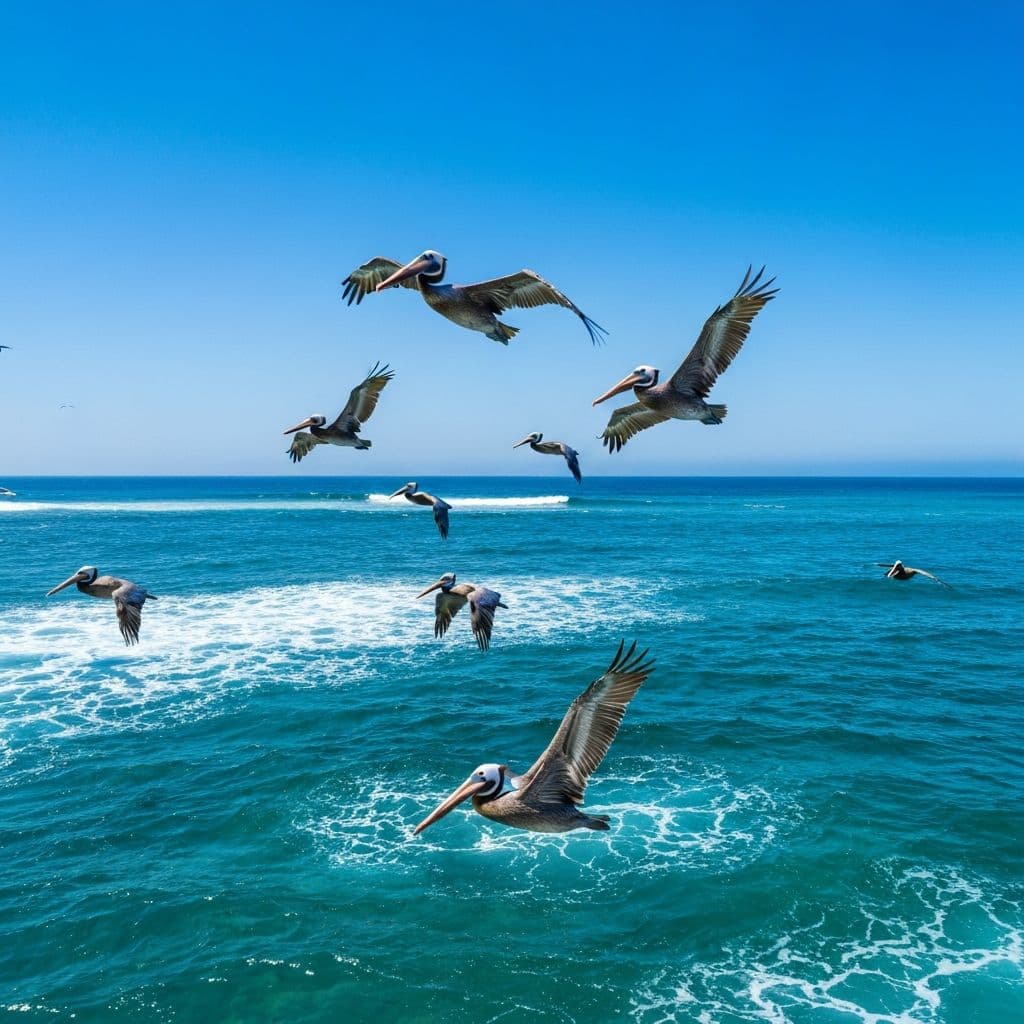
- Pelicans: in 2014–2016 nesting attempts dropped in extreme, unprecedented ways in the southern Gulf of California [6].
- Sea lions: in 2015, at the San Benito archipelago, their abundance fell 52% compared to 2014 [7].
The lesson for 2026
The Blob taught an important lesson: when an El Niño arrives on an ocean that's already warm, the effects add up. In 2015–2016, California Current temperatures reflected the persistence of those multi-year anomalies more than El Niño itself [8]. Read what the 2026 super El Niño means.
Experience it with Keabelmet

Frequently asked questions
What was The Blob?
A marine heatwave that between 2013 and 2015 warmed much of the northeast Pacific and pushed tropical species farther north than ever [1].
How did The Blob affect Magdalena Bay?
In 2015 upwelling weakened, nutrients and chlorophyll dropped, and zooplankton stayed scarce through 2017 [2].
How warm did the sea get off Magdalena Bay?
In July 2014 it reached +4.3 °C above the 1991–2020 average, the most anomalous month since 1982 according to NOAA data [5].
Scientific sources
The wildlife, season and geography facts in this article come from these publications. The [n] citations in the text link here.
- Cavole, L. M., Demko, A. M., Diner, R. E., Giddings, A., Koester, I., Pagniello, C. M. L. S., et al. (2016). Biological impacts of the 2013–2015 warm-water anomaly in the Northeast Pacific: winners, losers, and the future. Oceanography 29(2): 273–285. doi.org/10.5670/oceanog.2016.32
- Jiménez-Quiroz, M. C., Cervantes-Duarte, R., Funes-Rodríguez, R., Barón-Campis, S. A., García-Romero, F. J., et al. (2019). Impact of “The Blob” and “El Niño” in the SW Baja California Peninsula: plankton and environmental variability of Bahia Magdalena. Frontiers in Marine Science 6: 25. doi.org/10.3389/fmars.2019.00025
- Ortiz-Ahumada, J. C., Álvarez-Borrego, S. & Gómez-Valdés, J. (2018). Effects of seasonal and interannual events on satellite-derived phytoplankton biomass and production in the southernmost part of the California Current System during 2003–2016. Ciencias Marinas 44(1): 1–20. doi.org/10.7773/cm.v44i1.2743
- NASA Ocean Biology Processing Group; NOAA SWFSC Environmental Research Division (2022). Chlorophyll-a, Aqua MODIS, NPP, L3SMI, global, 4 km, science quality, monthly composite. Conjunto de datos erdMH1chlamday, NOAA ERDDAP. coastwatch.pfeg.noaa.gov/erddap/info/erdMH1chlamday/index.ht…
- Huang, B., Liu, C., Banzon, V., Freeman, E., Graham, G., Hankins, B., Smith, T. & Zhang, H.-M. (2021). Improvements of the Daily Optimum Interpolation Sea Surface Temperature (DOISST) Version 2.1. Journal of Climate 34(8): 2923–2939 (datos NOAA OISST v2.1 vía ERDDAP, consultados en octubre de 2026). doi.org/10.1175/JCLI-D-20-0166.1
- Anderson, D. W., Godínez-Reyes, C. R., Velarde, E., Ávalos-Téllez, R., Ramírez-Delgado, D., et al. (2017). Brown pelicans, Pelecanus occidentalis californicus (Aves: Pelecanidae): five decades with ENSO, dynamic nesting, and contemporary breeding status in the Gulf of California. Ciencias Marinas 43(1): 1–34. doi.org/10.7773/cm.v43i1.2710
- Elorriaga-Verplancken, F. R., Sierra-Rodríguez, G. E., Rosales-Nanduca, H., Acevedo-Whitehouse, K. & Sandoval-Sierra, J. (2016). Impact of the 2015 El Niño-Southern Oscillation on the abundance and foraging habits of Guadalupe fur seals and California sea lions from the San Benito Archipelago, Mexico. PLOS ONE 11(5): e0155034. doi.org/10.1371/journal.pone.0155034
- Jacox, M. G., Hazen, E. L., Zaba, K. D., Rudnick, D. L., Edwards, C. A., Moore, A. M. & Bograd, S. J. (2016). Impacts of the 2015–2016 El Niño on the California Current System: early assessment and comparison to past events. Geophysical Research Letters 43(13): 7072–7080. doi.org/10.1002/2016GL069716